


Learn More About Us
For local service businesses, the difference between ranking in Google's Map Pack and being buried on page two is not just a matter of pride; it directly determines whether a phone rings or not. The top three Map Pack positions capture the majority of local clicks, while businesses ranked below position 10 are effectively invisible.
Bliss Drive took on multiple clients, spanning home services, HVAC, plumbing, kitchen design, and general contracting, who shared a common starting problem: low local map visibility and zero Map Pack presence despite offering quality services in competitive markets.
Traditional keyword ranking tools show a single position for a keyword. But local search does not work that way. Google serves different results to someone searching one block away from a business versus five miles out. To capture this reality, we use geo-grid rank tracking.
What is a local ranking grid?
We track each client's keyword rankings at 169 individual geographic points arranged in a 13×13 grid at 1-mile spacing across their service area. Each dot on the grid shows what position the business appears in Google Maps for that exact location. Lower numbers are better — positions 1–3 mean the business appears in the coveted Google Map Pack. The color coding makes the data readable at a glance: green is strong, yellow/orange is mid-range, red is weak or invisible.
This grid approach lets us see:
Our approach combines four interconnected pillars. None of them works in isolation; the compounding effect of all four running simultaneously is what produces the dramatic grid transformations documented in this report.
The GBP listing is the foundation of Map Pack eligibility. Before any off-page work can take hold, the listing itself must send the right signals to Google. Our GBP work includes:
Citations are online mentions of a business's Name, Address, and Phone number (NAP). Google uses citation consistency and volume to determine how trustworthy and established a business is in a geographic area.
One of our most effective and differentiated tactics is what we call the Driving Directions Strategy. Google's local algorithm is heavily influenced by behavioral signals — real user actions that indicate a business is popular and trustworthy in its area.
The driving directions signal works by generating authentic navigation requests from real locations within the target service area grid. When Google sees a consistent pattern of users requesting directions to a business from across its service territory, it interprets this as a strong trust and relevance signal for that geographic area.
Google's Map Pack algorithm weighs Proximity, Relevance, and Prominence. Traditional SEO addresses relevance (content) and off-page prominence (links). The driving directions strategy directly feeds the behavioral dimension of prominence — giving Google real-world proof that customers from across the service area are actively choosing and navigating to this business.
Beyond behavioral signals, traditional backlink authority still matters for local rankings — especially for competitive terms and for expanding the green core beyond the immediate GBP location.
The following examples show real grid data from active Bliss Drive campaigns. Each grid represents a 13×13 map of 169 unique geographic checkpoints. The numbers inside each dot show the client's Google Maps ranking position from that exact location. All client names have been anonymized.
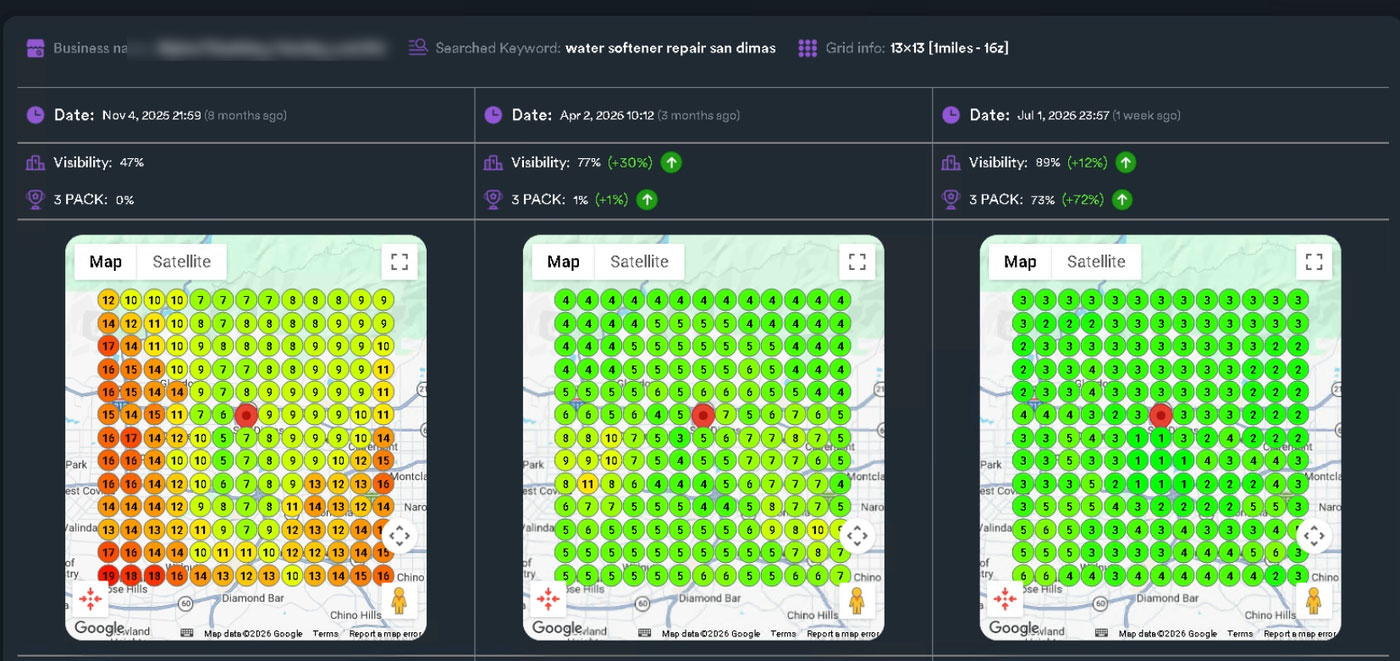
Grid progression for "Water Softener Repair" — November 2025 (47% visibility, 0% Map Pack) → April 2026 (77%, 1% Map Pack) → July 2026 (89%, 73% Map Pack). What started as a predominantly red-orange grid became a near-fully green grid with the majority of points ranking #1–3. Client identity blurred.
This example shows the full arc of a successful local SEO campaign. The first four months (to April) focused on building the visibility foundation — GBP signals, citation cleanup, and behavioral link-building pulled overall visibility from 47% to 77%. The final three months saw the Map Pack signal breakthrough: 3-Pack coverage jumped from 1% to 73%, meaning customers searching from nearly anywhere in the service area now see this client directly in Google's local results pack.
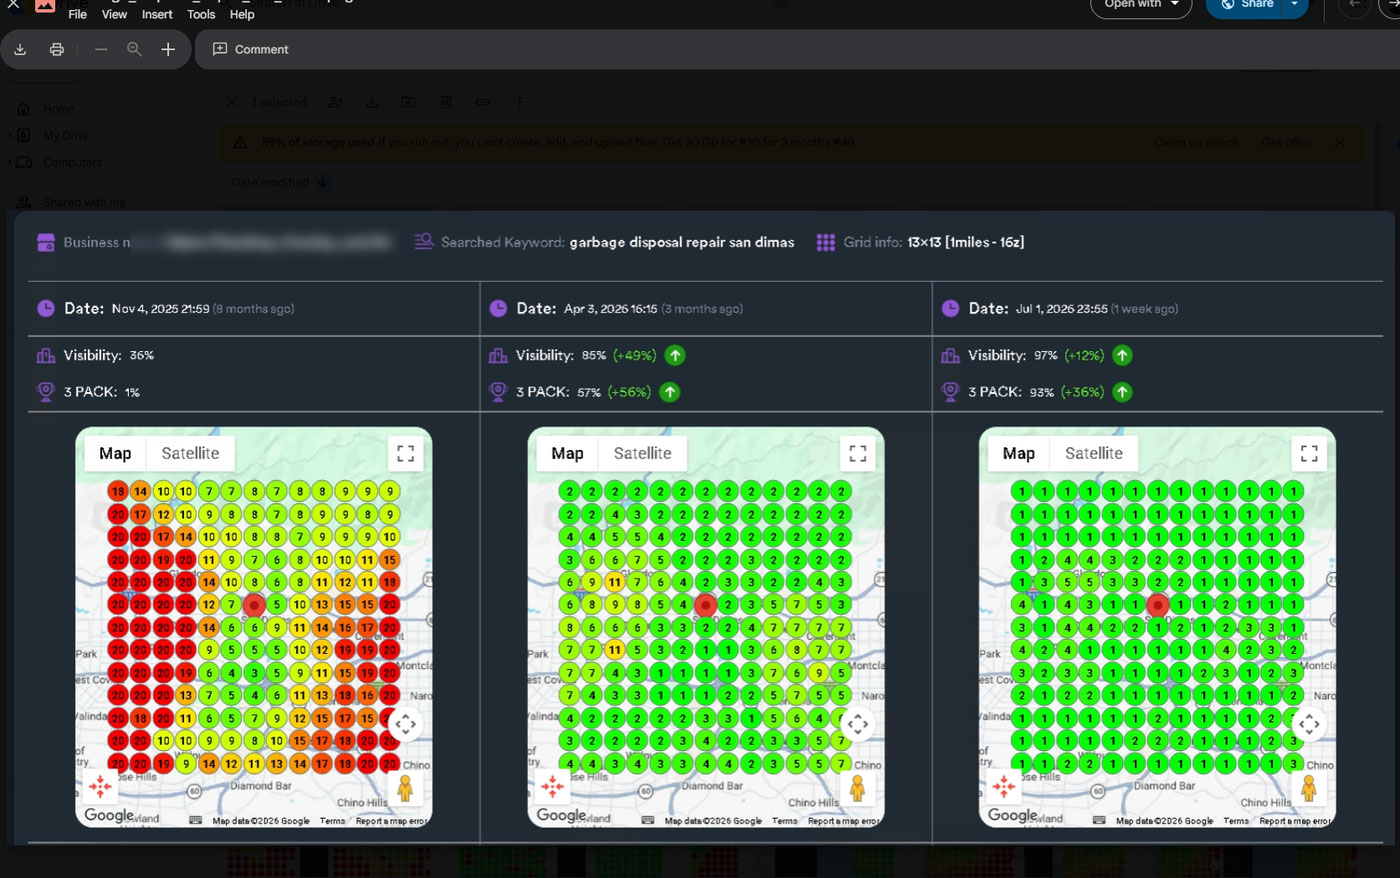
Grid progression for "Garbage Disposal Repair" — November 2025 (36% visibility, 1% Map Pack) → April 2026 (85%, 57% Map Pack) → July 2026 (97%, 93% Map Pack). By July, nearly the entire service area grid sits at position 1. Client identity blurred.
This is the standout result in the dataset. Starting from a 36% visibility base with minimal Map Pack presence, the campaign reached 97% visibility and 93% Map Pack coverage within eight months. By July, the grid is nearly entirely filled with #1 and #2 positions. This level of saturation means the client is the first business customers see when searching from virtually anywhere in their service territory.
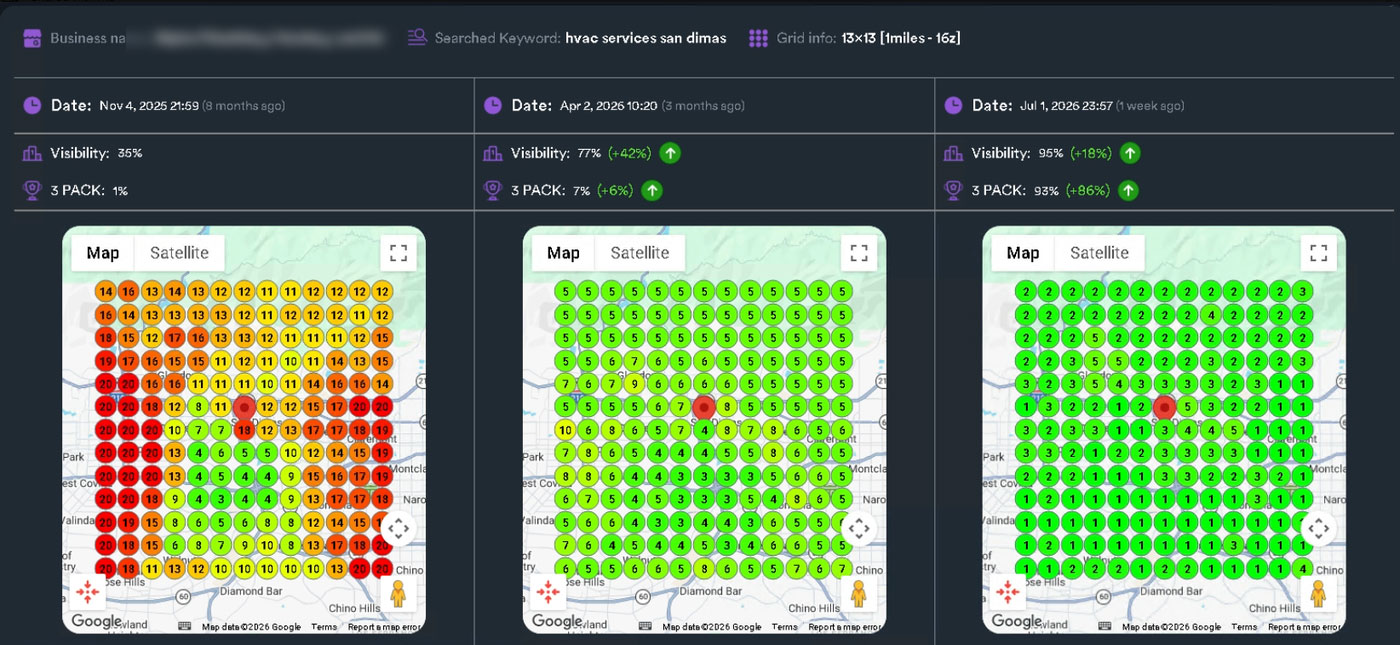
Grid progression for "HVAC Services" — November 2025 (35% visibility, 1% Map Pack) → April 2026 (77%, 7% Map Pack) → July 2026 (95%, 93% Map Pack). The July grid is wall-to-wall #1s and #2s — a near-identical outcome to the Garbage Disposal example, achieved in a completely separate market. Client identity blurred.
The HVAC result is significant because it replicates the same near-perfect grid saturation achieved in the Garbage Disposal campaign — but in a different geography and vertical entirely. That is not coincidence. When the same methodology produces the same outcome across unrelated markets, it confirms the strategy is systematic and repeatable, not a one-off. Starting at 35% visibility and 1% Map Pack, the campaign delivered 95% visibility and 93% Map Pack coverage in eight months.
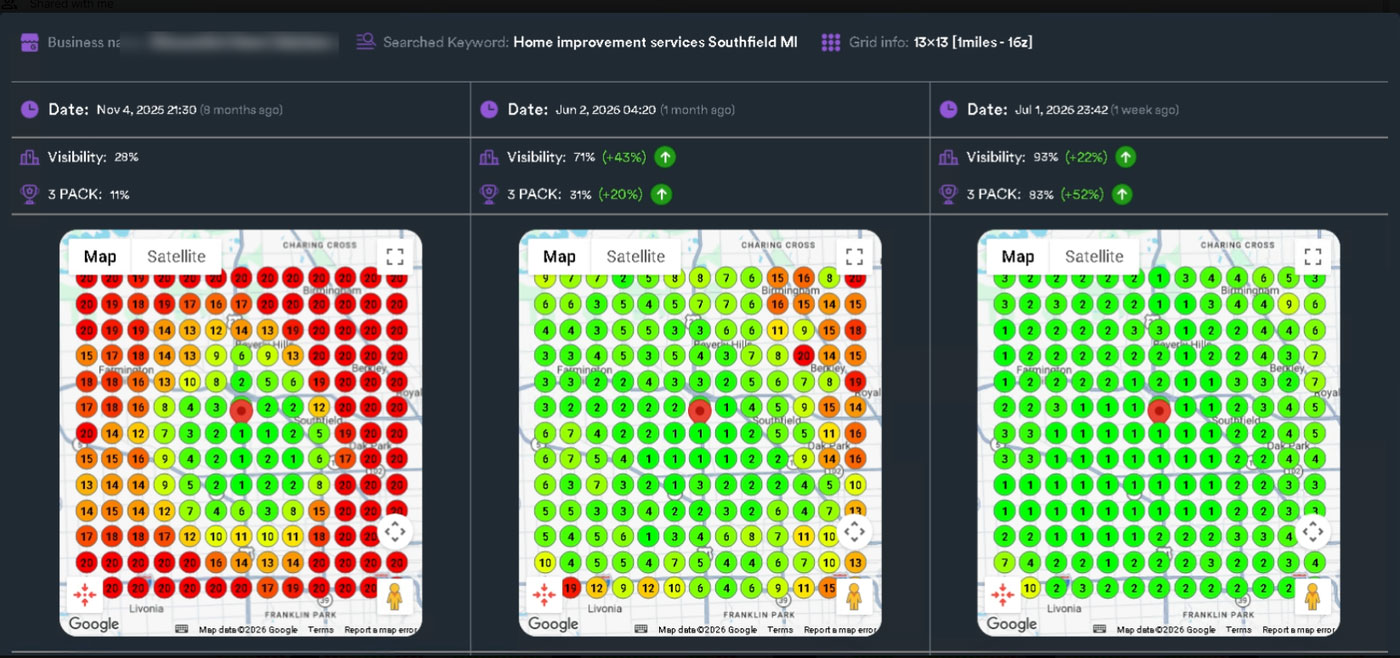
Grid progression for "Home Improvement Services Southfield MI" — November 2025 (28% visibility, 11% Map Pack) → June 2026 (71%, 31% Map Pack) → July 2026 (93%, 83% Map Pack). The campaign built on an existing Map Pack foothold and expanded it to near-full coverage in eight months. Client identity blurred.
This campaign started with a small but real Map Pack foothold — 11% 3-Pack coverage in November — and turned it into 83% coverage by July. The grid tells a clear story: the green core that already existed around the business location was methodically expanded outward until it covered the vast majority of the service area. The +65 point visibility gain is the largest in this report, and the final grid is one of the most uniformly green in the dataset.
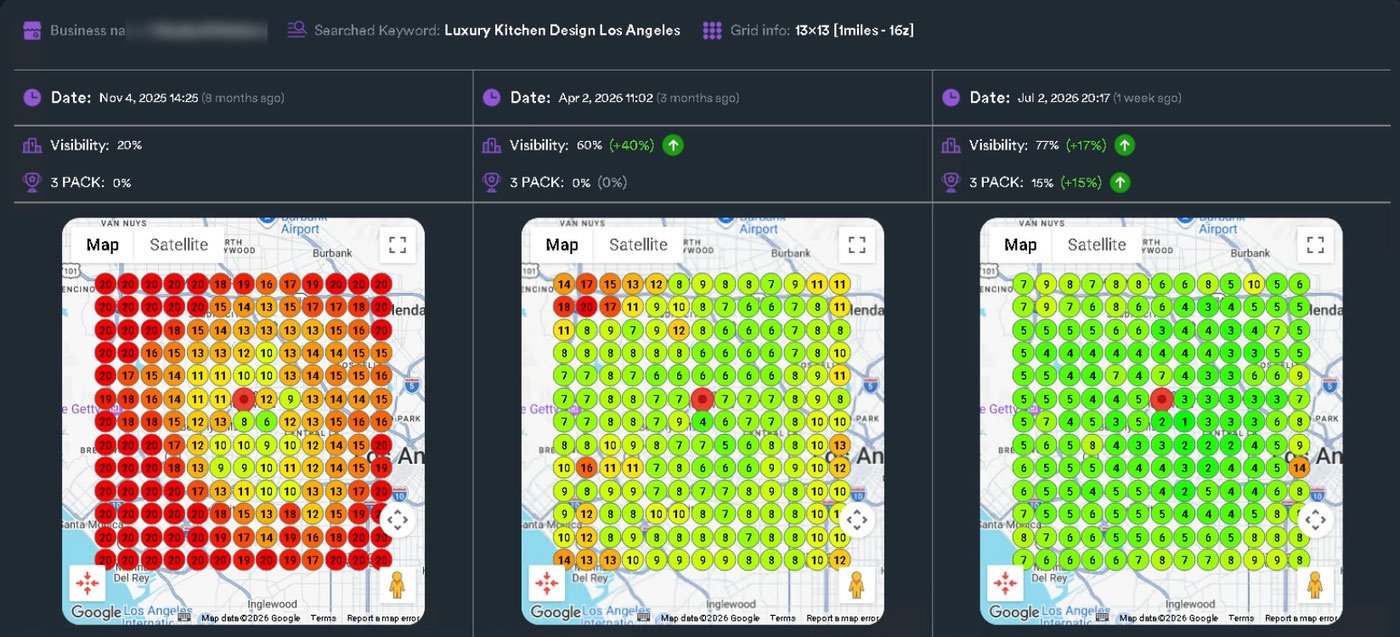
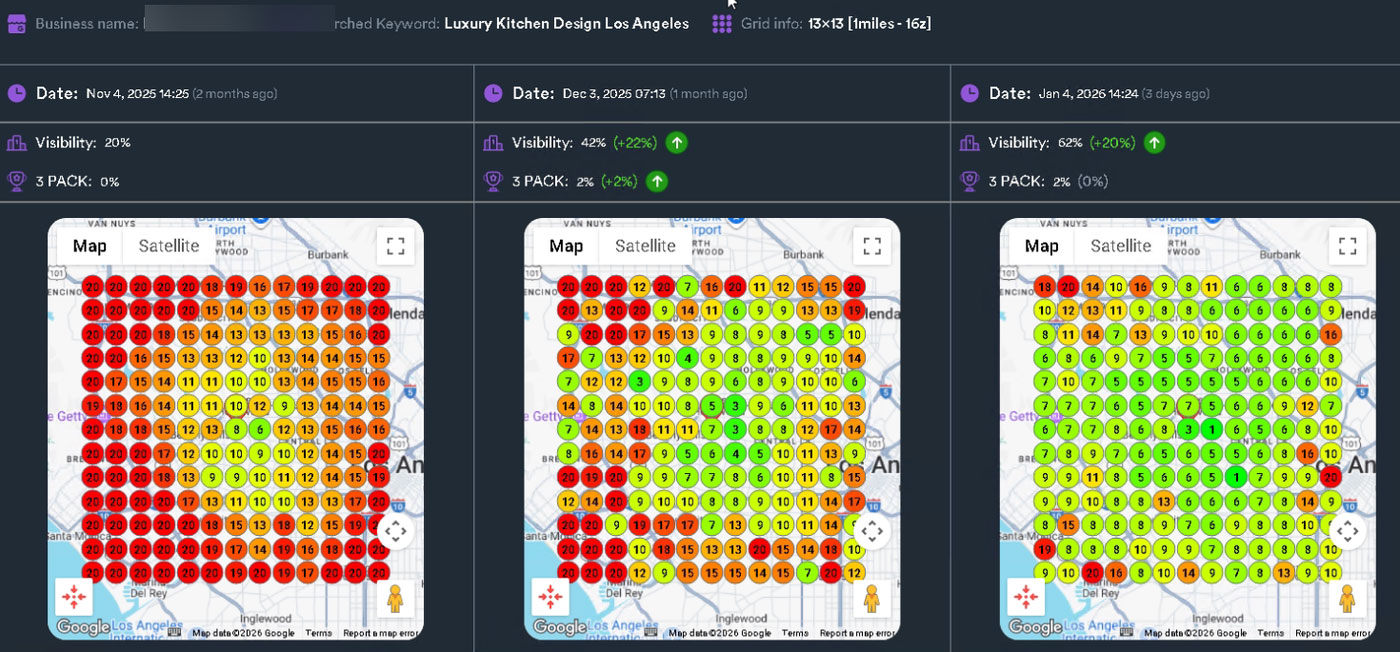
Grid progression for "Luxury Kitchen Design" in Los Angeles — November 2025 (20% visibility, 0% Map Pack) → April 2026 (60%, 0%) → July 2026 (77%, 15% Map Pack). A highly competitive search term in a large metro market. Client identity blurred.
"Luxury Kitchen Design" is among the most competitive local search terms in the Los Angeles market — high intent, high ticket, and heavily contested. Starting from only 20% visibility, the campaign systematically built outward. By July, the green core has spread across most of the grid, and 15% Map Pack coverage represents the early stage of a term that is now on its conversion trajectory. This result also demonstrates that the strategy applies across very different keyword difficulty levels — from mid-competition home services to premium, high-value renovation terms in major metros.
Across all featured campaigns, Bliss Drive's local SEO methodology produced consistent, measurable improvements in grid visibility and Map Pack presence. The table below summarizes key results across the full keyword portfolio tracked in this report.
| Keyword | Start | End | Improvement | Map Pack |
|---|---|---|---|---|
| Water Softener Repair | 47% | 89% | +42 points | 73% (from 0%) |
| Garbage Disposal Repair | 36% | 97% | +61 points | 93% (from 1%) |
| HVAC Services | 35% | 95% | +60 points | 93% (from 1%) |
| Home Improvement Services | 28% | 93% | +65 points | 83% (from 11%) |
| Luxury Kitchen Design (LA) | 20% | 77% | +57 points | 15% (from 0%) |
| Home Improvement (Alexandria) | 74% | 93% | +19 points | 83% (from 31%) |
| Window Installation | 97% | 99% | +2 points | 100% (held) |
| Siding Installation | 89% | 95% | +6 points | 89% (from 72%) |
| Asphalt Roof Installation | 17% | 38% | +21 points | 1% (building) |
| Metal Roof Installation | 24% | 30% | +6 points | Climbing |
Local SEO is not a set-and-forget channel. The campaigns featured in this study are ongoing, and the playbook for continued progress follows the same principle that got each client this far: target the weak zones, reinforce the strong ones, and let behavioral and authority signals compound over time.